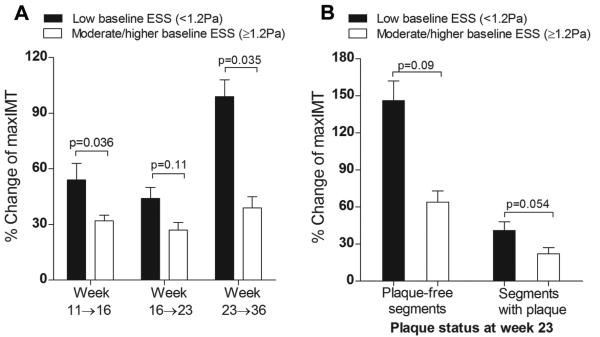
Figure 2.
A, Progression of plaque severity, assessed by relative change of maxIMT (%Δmax IMT) between consecutive time points in relation to baseline ESS. Segments exposed to low ESS (<1.2Pa) at weeks 11, 16 and 23 exhibited greater relative increase of maxIMT between weeks 11→16, 16→23 and 23→36, respectively, compared to segments with moderate/higher baseline ESS (≥1.2 Pa). B, Progression of plaque severity following week 23 was more marked in segments of low vs. moderate/higher ESS at week 23, both in plaque-free segments (maxIMT<0.5mm) and in segments that already contained significant plaque (maxIMT≥0.5mm) at this time point.

