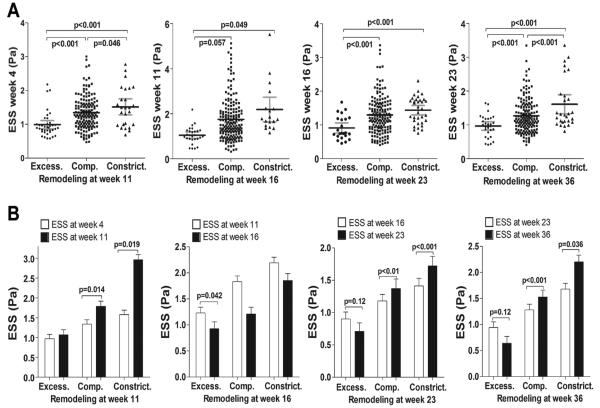
Figure 4.
A, Local ESS at weeks 4, 11, 16 and 23 in segments categorized by the remodeling pattern at the immediately following time point, i.e. week 11, 16, 23 and 36, respectively. At all time points, segments with excessive expansive remodeling had significantly lower preceding ESS compared to segments with compensatory or constrictive remodeling. B, Impact of each remodeling pattern on local ESS. For segments with each remodeling pattern at all time points, local ESS at any given time point of remodeling assessment is compared to the local ESS at the immediately preceding time point. ESS generally tended to further decrease in segments with excessive expansive remodeling, and increased in segments with compensatory, or constrictive remodeling.

