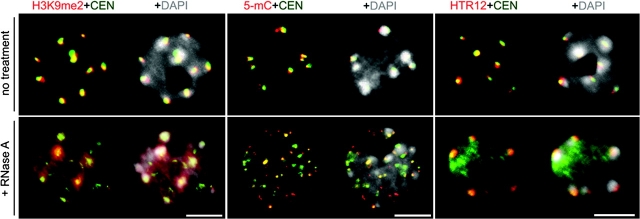
Figure 6.
Effects of RNase A Treatment on the Interphase Organization of Centromere Repeats (Green), H3K9me2 (Red), and 5-mC (Red) Detected by DNA-FISH and Immunostaining.
Representative images of untreated and nuclease treated (+RNase) nuclei are shown. The right-most nuclei depict immunostaining of HTR12 (red) and 180-bp pericentromeric repeats (green) in non-treated and RNase A-treated nuclei. DNA was visualized by DAPI (gray). Size bars indicate 5 μm.

