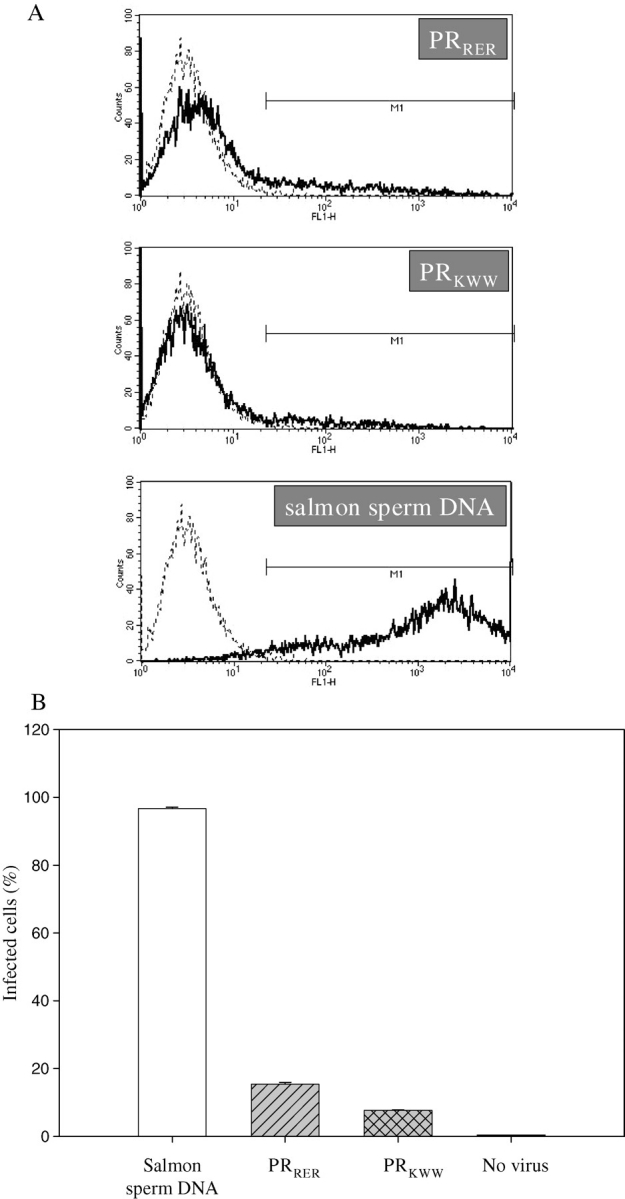
Fig. 7.

Fluorescence-activated cell sorting (FACS) analyses of 293T cells infected by viral particles containing wild-type protease (produced by cells infected with DNA mix at 2:1 ratio of salmon sperm DNA and wt plasmid) or mixture wt and mutant proteins (produced by cells infected with DNA mix at 2:1 ratio of mutant:wt plasmid). (A) Histograms of representative experiments. Population of non-infected cells is shown with dashed line. (B) Bar chart of summary of parallel experiments of FACS analyses. Error bars are small and therefore not visible in all cases.
