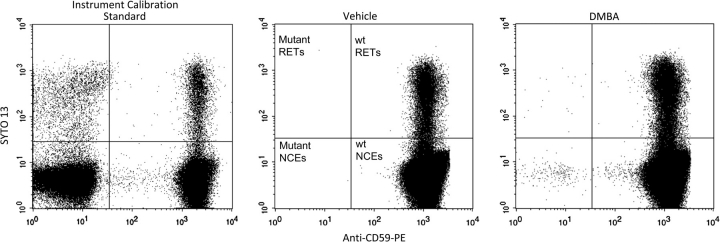
FIG. 2.
Bivariate plots of representative SYTO 13 versus anti-CD59-PE fluorescence profiles (gated events, i.e., erythrocytes). Left: Instrument calibration standard; mutant-mimicking cells were spiked into blood that was processed according to the standard protocol. This specimen provides enough events with a full range of fluorescence intensities to optimize PMT voltages and compensation settings. This calibration standard also provides a means for rationally and consistently setting the position of the vertical demarcation line that discriminates mutant versus nonmutant cells. Middle: Vehicle control rat blood; note the very low incidence of cells in the upper left and lower left quadrants. These anti-CD59-negative events are Pig-a mutant phenotype reticulocytes and mature erythrocytes, respectively. Right: Blood obtained 45 days after treatment with the mutagen DMBA. Note the elevated numbers of events that appear in the upper left and lower left quadrants, i.e., Pig-a mutant phenotype reticulocytes and mature erythrocytes, respectively.

