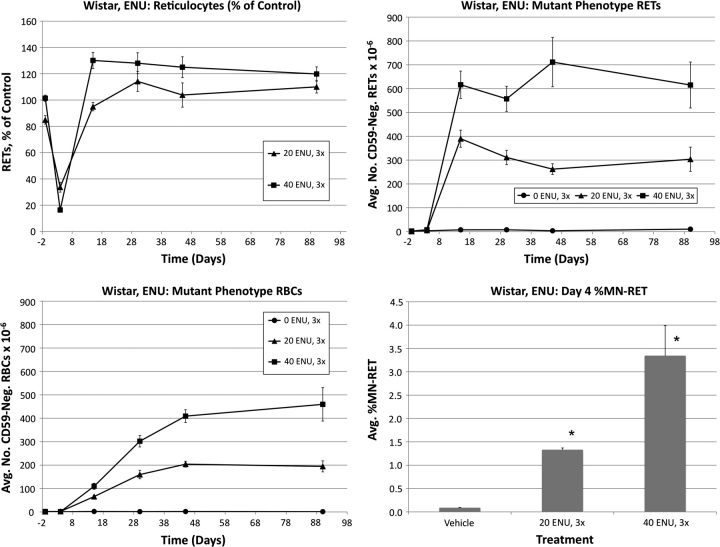
FIG. 3.
Frequencies of RETs, RETCD59−, RBCCD59−, and MN-RET following treatment with ENU, Wistar rats. Upper left: Average reticulocytes values as a percentage of vehicle control as a function of time relative to treatments that occurred on days 1–3. Error bars are SEM. Upper right: Average mutant phenotype reticulocyte frequencies as a function of time. Error bars are SEM. Lower left: Average mutant phenotype erythrocyte frequencies as a function of time. Error bars are SEM. Lower right: Average MN-RET frequencies at day 4 as a function of dose. Error bars are SEM. Asterisks denote statistical significance, p < 0.05 (Dunnett’s test).

