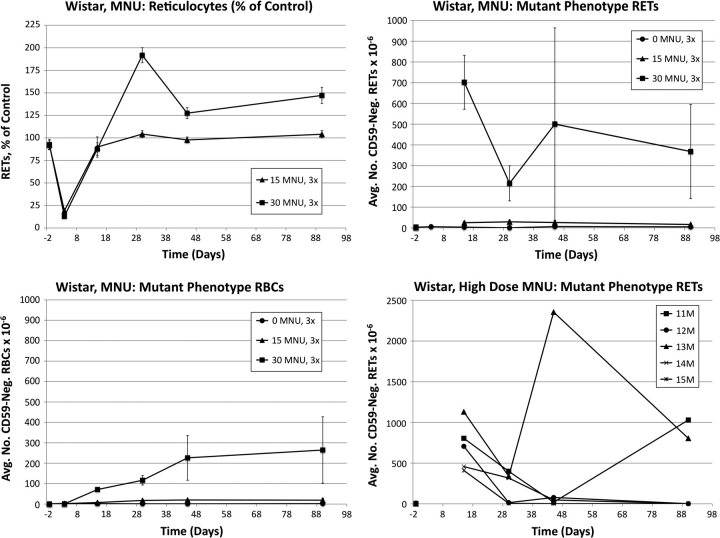
FIG. 4.
Frequencies of RETs, RETCD59−, and RBCCD59− following treatment with MNU, Wistar rats. Data are formatted as in Figure 3, except that RETCD59− frequencies are not graphed for day 4 (too few RETs were acquired); also, the lower right panel does not portray micronucleus values but rather mutant phenotype reticulocyte values of individual animals in the high-dose group as a function of time.

