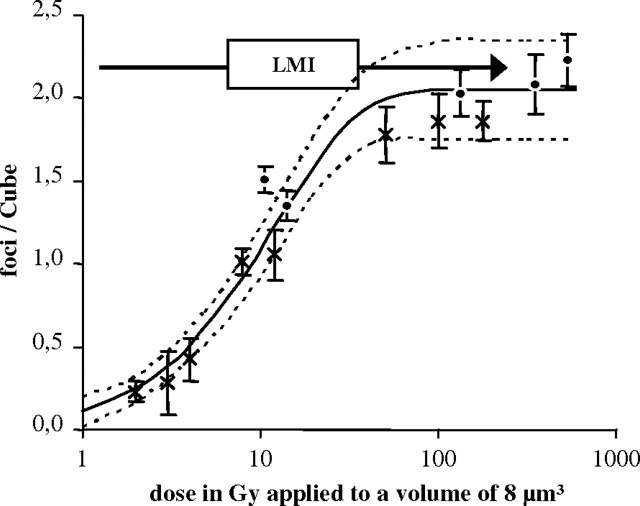
Fig. 4.
Dose–response curve for irradiation-induced RPA foci using a cubic volume (8 μm3) for foci quantification. Resulting dose–response curve over a logarithmical x-axis after application of the Cube volume. The monoexponential curve (solid line) is fitted in the charged particle and X-ray data points (R2 = 0.96). The allocation of the laser data points to the fit curve is indicated for a laser exposure of 0.3 MJ/m2 (2.2 ± 0.2 foci per Cube; arrow). Error bars indicate the standard error of the mean, whereas the dotted lines represent the 95% confidence interval of the fit curve.

