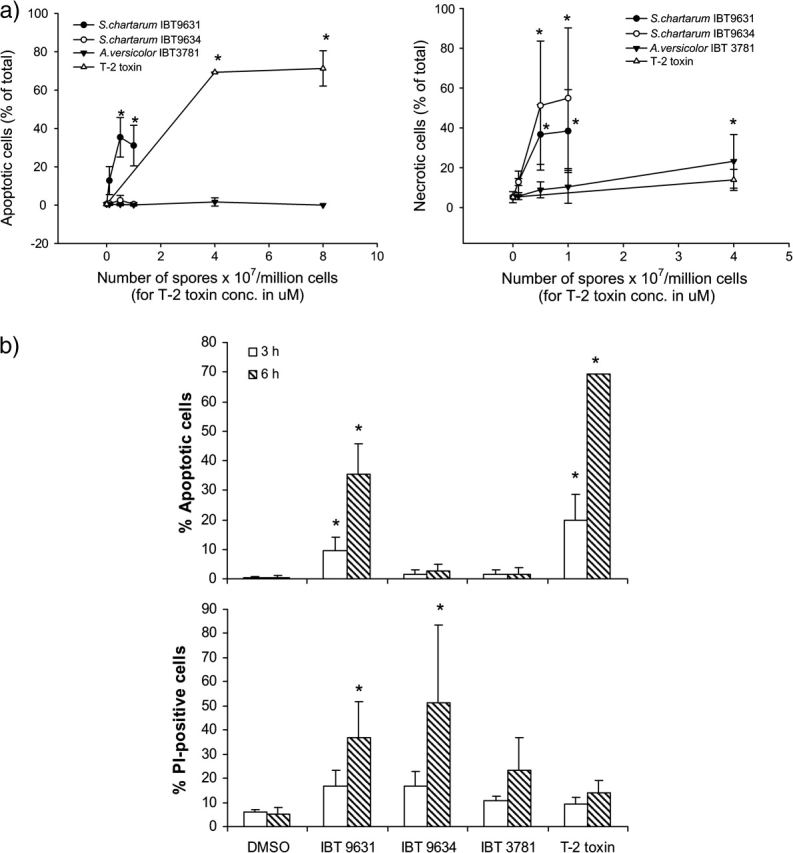
FIG. 2.

Cell death induced by spores or T-2 toxin treatment. (a) Concentration-dependent changes in apoptosis and necrosis in THP-1 cells after exposure to spores or T-2 toxin for 6 h. Cells were stained with Hoechst 33342 and PI and analyzed by fluorescence microscopy. Results are shown as percent apoptotic or necrotic cells of total cell number. Values represent mean ± SD of at least n = 3 experiments. *Statistical difference from control (p < 0.05). (b) Increased apoptosis and necrosis in THP-1 cells after exposure to spores or T-2 toxin for 3 and 6 h. The concentrations of spores were 0.5 × 10⁷ spores/million cells (S. chartarum IBT 9631 and IBT 9634) or 4.0 × 10⁷ spores/million cells (A. versicolor IBT 3781), whereas the toxin concentration was 4μM. Cells were stained with Hoechst 33342 and PI and analyzed by fluorescence microscopy. Results are shown as percent apoptotic or necrotic cells of total cell number. Values represent mean ± SD of at least n = 3 experiments. *Statistical difference from control (p < 0.05).
