FIG. 3.

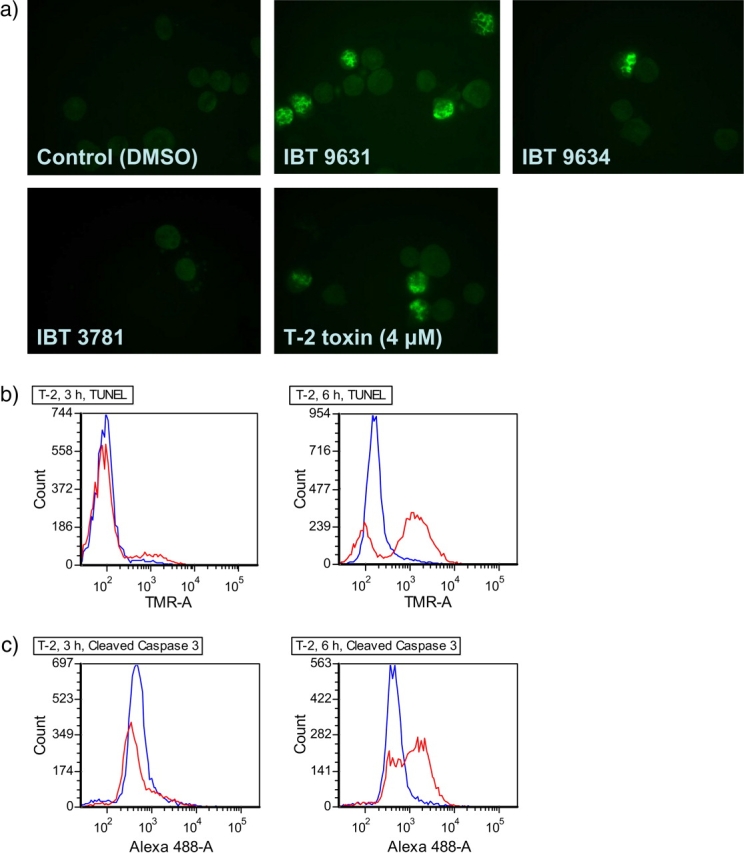
Apoptosis induced by spores or T-2 toxin treatment. (a) Apoptosis induced by S. chartarum IBT 9631 measured by immunofluorescence. The concentrations of spores were 0.5 × 10⁷ spores/million cells (S. chartarum IBT 9631 and IBT 9634) or 4.0 × 10⁷ spores/million cells (A. versicolor IBT 3781), whereas the toxin concentration was 4μM. Pictures of cells stained with antibodies against the apoptotic marker cleaved PARP after exposure for 3 h. (b) Apoptosis induced by T-2 toxin (4μM) measured by TUNEL assay after 3 and 6 h exposure. Blue lines represent control cells (DMSO treated) and red lines represent toxin-exposed cells. Increase in TMR intensity indicates increased levels of free 3′ OH ends in DNA, resulting from apoptotic DNA strand breaks. (c) Apoptosis induced by T-2 toxin (4μM) measured by flow cytometry analysis of cells stained with antibodies against the apoptotic marker cleaved caspase 3 after 3 and 6 h exposure. Blue lines represent control cells (DMSO treated) and red lines represent toxin-exposed cells. Increase in Alexa 488 intensity indicates increased levels of cleaved caspase 3 in the cells.
