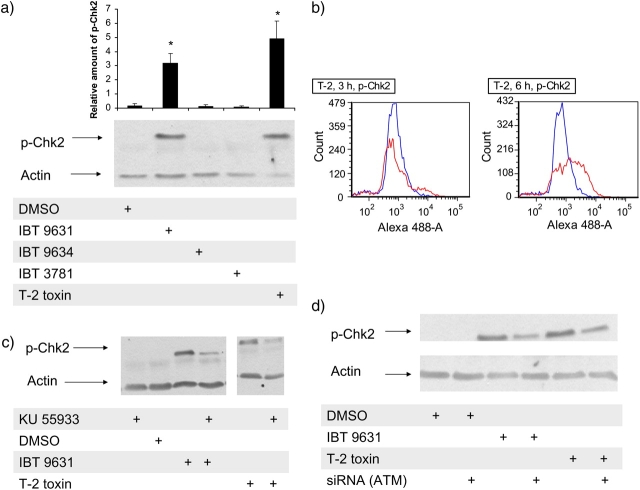
FIG. 8.
Phosphorylation of Chk2 induced in THP-1 cells after exposure to spores or T-2 toxin. (a) Cells were exposed to 0.5 × 10⁷ spores/million cells (S. chartarum IBT 9631 and IBT 9634), 4.0 × 10⁷ spores/million cells (A. versicolor IBT 3781), or 4μM T-2 for 3 h. Phosphorylation of Chk2 was analyzed by Western blotting. Blots were washed and reprobed with an anti-actin polyclonal antibody. The blots were quantified and the relationship between the level of Chk2 and actin is shown as horizontal bars on top of the figure. Values represent mean ± SD of n = 3 experiments. *Statistical difference from control (p < 0.05). One representative blot is shown. (b) Phosphorylation of Chk2 analyzed by flow cytometry after exposure of THP-1 cells to 4μM T-2 toxin for 3 and 6 h. Blue lines represent control cells (DMSO treated) and red lines represent toxin-exposed cells. Increase in Alexa 488 intensity indicates presence of phosphorylated Chk2 in the cells. (c) Effects of the ATM inhibitor KU 55933 on spore- or toxin-induced phosphorylation of Chk2. Cells were preincubated with or without inhibitor (5μM) for 1 h, followed by incubation with 0.5 × 10⁷ spores/million cells (S. chartarum IBT 9631) or 4μM T-2 toxin for 3 h. Effects on phosphorylation of Chk2 were analyzed by Western blotting. (d) Effects of siRNA against ATM on spore- or toxin-induced phosphorylation of Chk2. Cells were transfected by electroporation with ATM siRNA before exposure to 0.5 × 10⁷ spores/million cells (S. chartarum IBT 9631) or 4μM T-2 toxin for 3 h. Effects on phosphorylation of Chk2 were analyzed by Western blotting.

