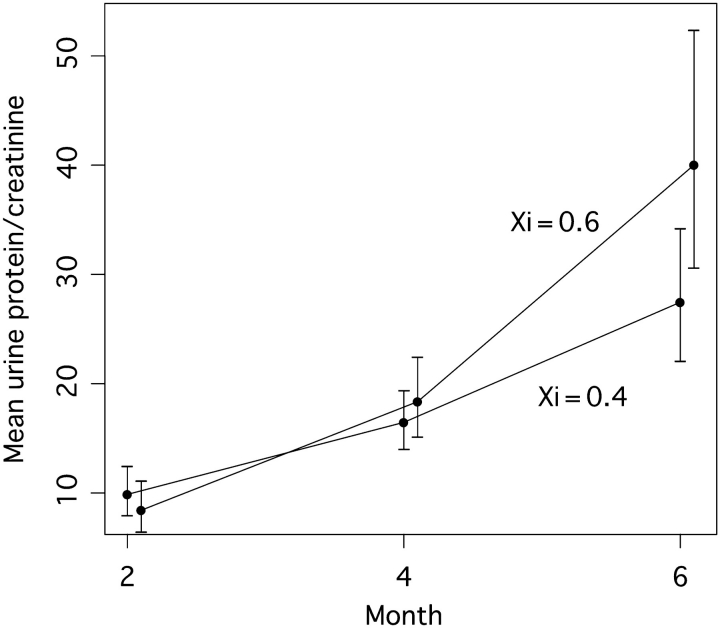
Fig. 3.
Predicted mean level and slope change in urine protein-to-creatinine ratio based on longitudinal analysis including Xi as a moderator of slope (i.e. including an Xi-by-age interaction). Specific examples of trajectories are given for Xi = 0.6 and Xi = 0.4. Vertical bars represent 95% CI of predicted mean urine protein-to-creatinine ratio at each time point. At 6 months, the 95% CIs do not overlap with the other mean values and this difference is statistically significant (P = 0.039).

