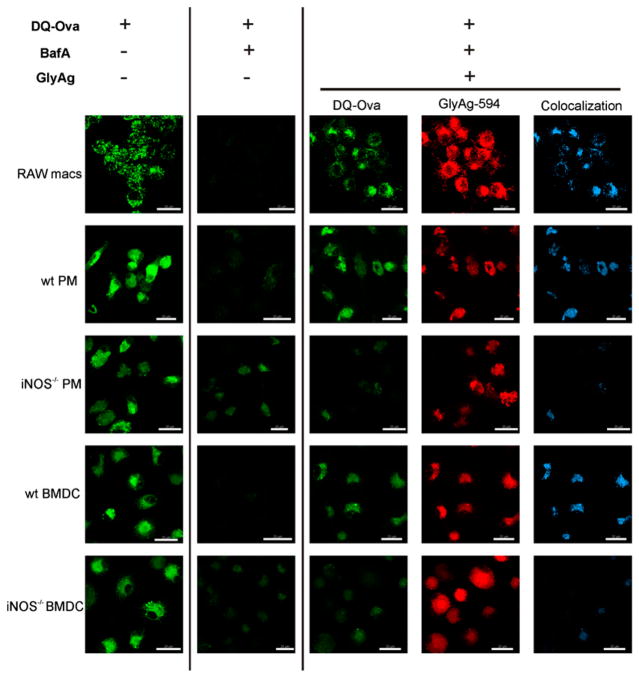
FIGURE 5.
NO oxidation of GlyAg leads to enhanced pH-dependent OVA processing. All images taken with a 63× oil immersion lens. Confocal images of untreated APCs (left column), APCs treated with 40 nM BafA to inhibit normal acidification (second column), and BafA-treated APCs incubated with 50 μg/ml AlexaFluor594-conjugated GlyAg (three right columns). All cells were incubated with 50 μg/ml DQ-OVA for 25 min before image capture. All cells readily processed DQ-OVA upon internalization (green), but cleavage was strongly inhibited by BafA (second column) as expected. Although all cells were equally able to endocytose GlyAg (red), only RAW macrophages and WT primary APCs were able to process OVA above the BafA background (middle column; green) when incubated with GlyAg. Colocalization images (blue; Imaris CoLoc software) show that essentially all green regions of the cells were also GlyAg positive (compare the green and blue images), suggesting that the pH effect was strictly localized. In contrast, both NO-deficient cells were unable to initiate acid-dependent processing of OVA, indicating that NO-mediated oxidation in the presence of GlyAg generated an acidic environment that promotes protein Ag processing. Scale bars, 20 μm.

