
Figure 3. Vascular response of U87 gliomas to DMXAA.
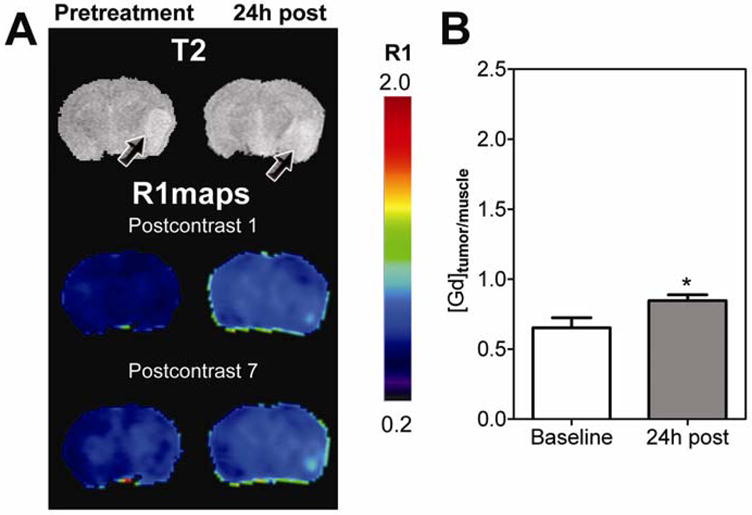
(A) Post contrast R1 maps of a nude mouse brain bearing U87 glioma before and after DMXAA treatment showing evidence of vascular disruption by DMXAA. R1 maps were calculated on a pixel-by-pixel basis from the first (1) and last (7) post contrast T1W scans. Corresponding T2W images are also shown. Arrows point to location of the tumor. (B) Concentration of Gd as estimated from normalized mean ΔR1 values (tumor/muscle) of U87 gliomas showing a statistically significant increase (*p<0.05) 24 hours post VDA therapy compared to baseline values.