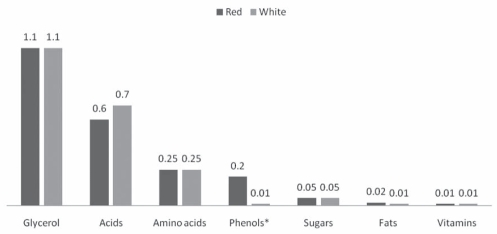
Figure 3).
Components of table wine. Estimates of typical gross composition (percentage weight). *Phenols constitute the major compositional difference between red and white table wines. Water and ethanol content is similar for both types of wine (87% and 10%, respectively). Adapted from reference 30

