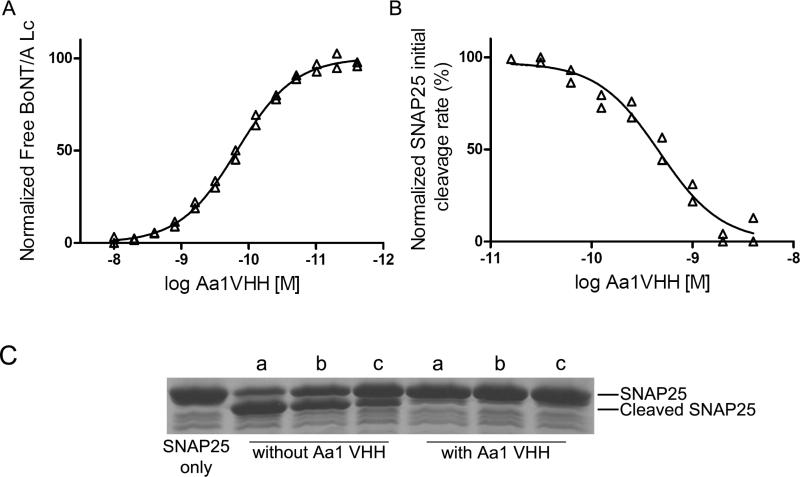
Figure 3. Characterization of the Aa1 VHH fragment.
(A) Solution KD. The solution KD of the purified Aa1 VHH fragment was measured by flow fluorimetry in a KinExA instrument. (B) Aa1 VHH fragment IC50 for GST-SNAP25141-206 cleavage by BoNT/A Lc. The indicated Aa1 VHH concentration was incubated with BoNT/A Lc and the FRET substrate YsCsY and the initial rate of cleavage determined from the change in the YFP fluorescence reading. IC50 was determined by fitting the initial rate and log Aa1 VHH concentration to a sigmoidal dose-response (variable slope) model. (C) SDS-PAGE analysis of the impact of reducing agents on Aa1 VHH inhibition of GST-SNAP cleavage by BoNT/A Lc. The Aa1 VHH was incubated with no reducing agent (a), 20 mM glutathione reduced (b), or 14 mM β-mercaptoethanol (c) for 15 min at 37°C followed by addition of BoNT/A Lc and GST-SNAP25141-206. After 15 min, cleavage was analyzed by SDS-PAGE.

