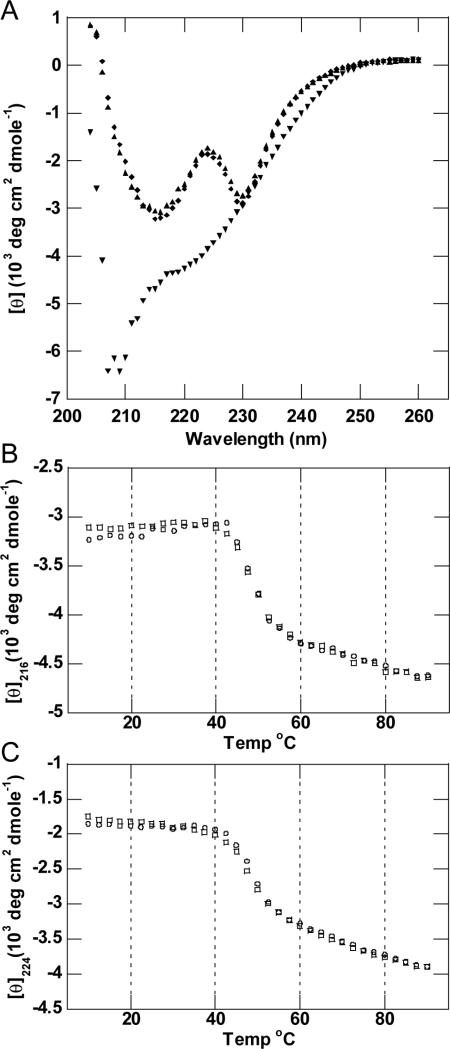
Figure 4. Thermal denaturation and refolding of Aa1 VHH.
(A) Far UV CD spectra of Aa1 VHH obtained at 10°C (◆) before melting, 90°C (▼) after melting, and 10°C (▲) following the melting and refolding of the protein. (B) (C) Thermal denaturation (○) and refolding (□) data of Aa1 VHH obtained by CD spectroscopy at a wavelength of 216 nm (panel B) and 224 nm (panel C).

