
Figure 1.
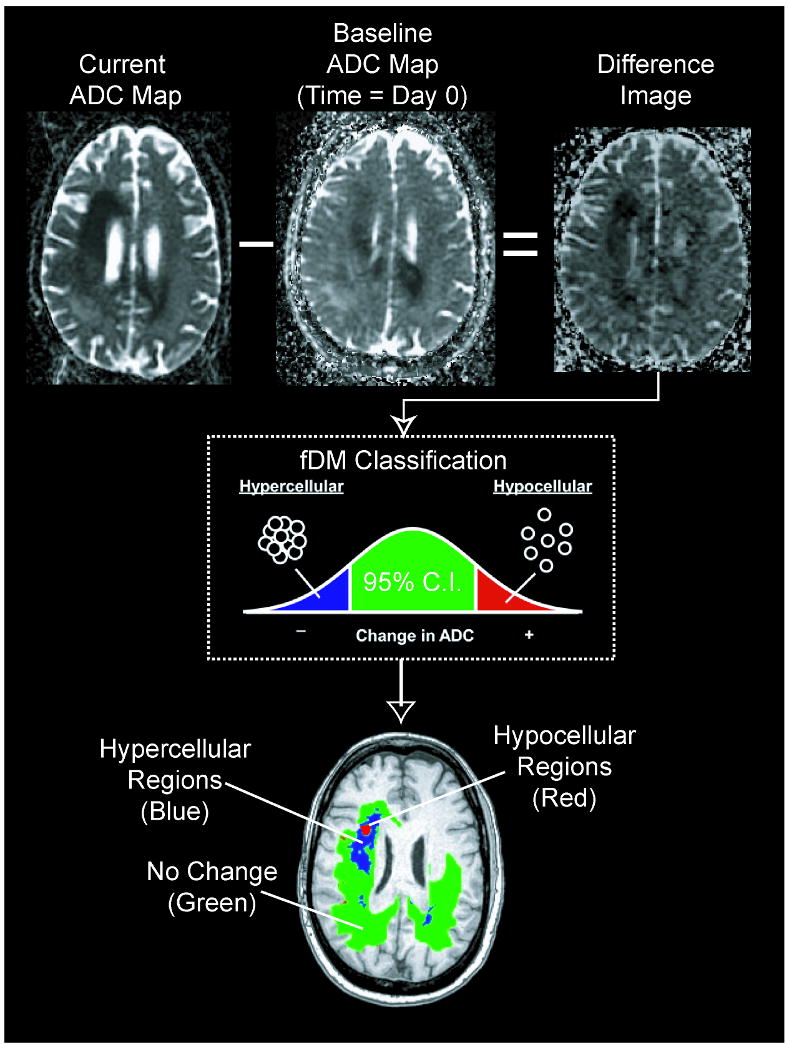
Calculation of functional diffusion maps from sequential apparent diffusion coefficient (ADC) maps. For each post-baseline time point, ADC maps from the current day are subtracted from baseline ADC maps. Each voxel within an ADC difference image is stratified into three categories based on the magnitude of the ADC change: a decrease in ADC suggestive of increased cellularity (blue voxels), an increase in ADC suggestive of decreased cellularity (red voxels), and those with no significant change in ADC (green voxels).