
Figure 2.
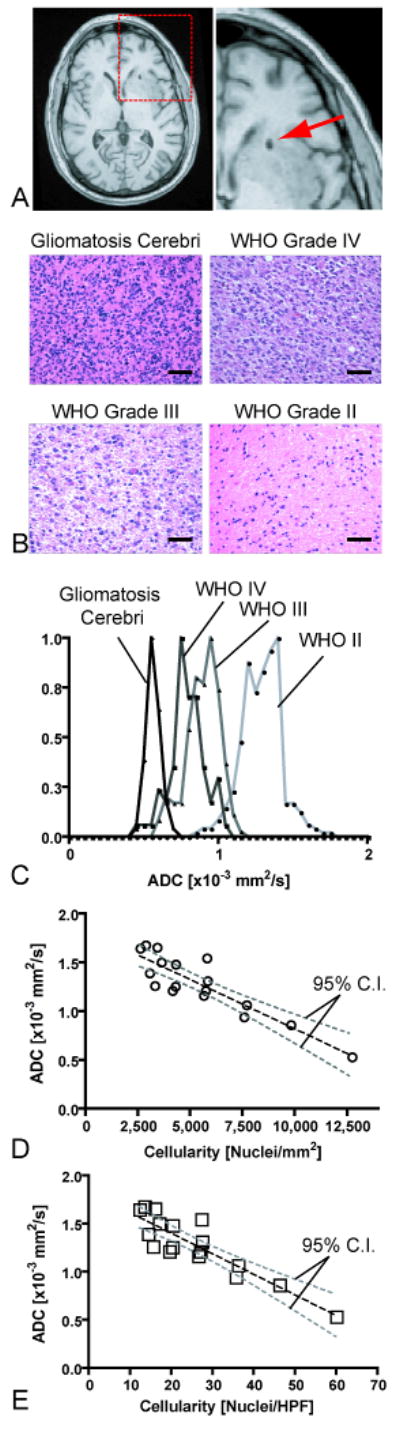
Correlation between spatially-matched ADC measurements and cell density from stereotactic biopsy samples. A) Post-operative, high-resolution 3D T1-weighted anatomical MR images showing the biopsy location in a single patient. B) Representative histological images (Hematoxylin & Eosin, 20× magnification) showing how cell density increases with an increase in tumor grade (scale bar = 50 μm). C) Spatially-matched ADC measurements taken from the biopsy location in the same four patients as (B), showing a decrease in ADC with an increase in tumor grade and cell density. D) Scatter plot of average ADC within stereotactic biopsy locations and average cellularity for 17 patients (circles) shows a significant linear correlation (Pearson's Correlation Coefficient, r2 = 0.7933; P < 0.0001) between mean ADC and mean cell density in nuclei/mm2. E) Correlation between mean ADC and mean cell density in nuclei per high power field (HPF). Dashed black line = linear regression line; dashed gray lines = 95% confidence intervals for the regression.