
Figure 3.
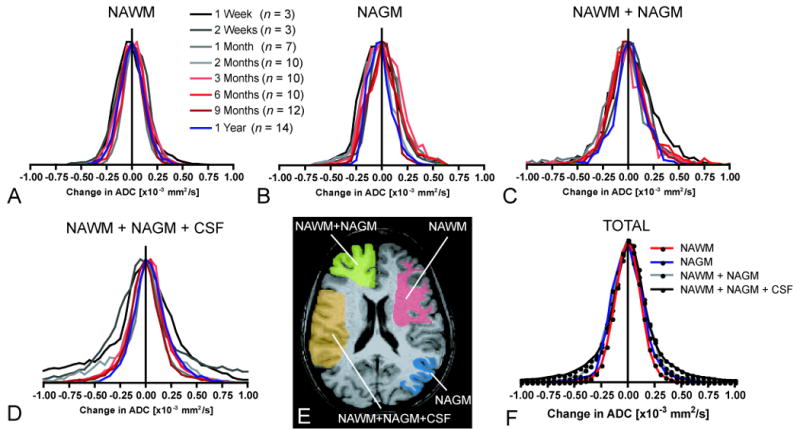
Distribution of ΔADC for different tissue types and different post-baseline times. A) ΔADC histograms for normal-appearing white matter (NAWM). B) ΔADC histograms for normal-appearing gray matter (NAGM). C) ΔADC histograms for a mixture of NAWM+NAGM. D) ΔADC histograms for a mixture of NAWM+NAGM+CSF (cerebrospinal fluid in subarachnoid space adjacent to cortical gray matter). E) Regions of interest (ROIs) containing mixtures of the various tissue types used in estimation of ΔADC variability. F) Pooled ΔADC distributions from all subjects and all post-baseline time points for each tissue type (n = 69 patients; N = 210,000 voxels).