
Figure 4.
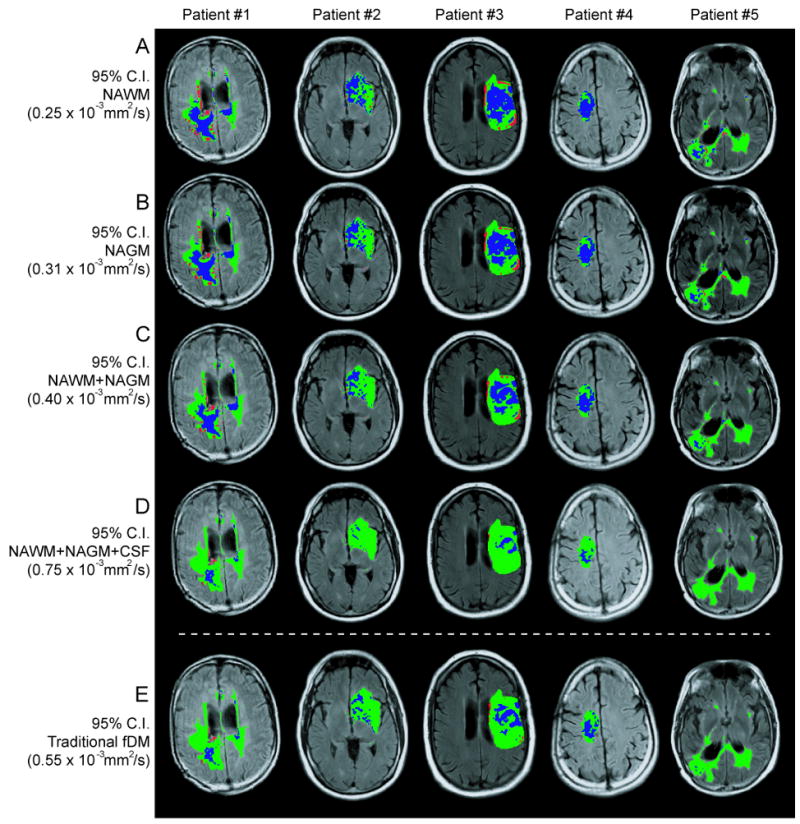
Functional diffusion maps for five representative glioblastoma patients, evaluated with five ΔADC thresholds: A) 95% confidence interval (C.I.) for normal-appearing white matter (NAWM), B) 95% C.I. for normal-appearing gray matter (NAGM), C) 95% C.I. for NAWM+NAGM, D) 95% C.I. for NAWM+NAGM+CSF (cerebrospinal fluid), and E) the standard fDM threshold used in human analysis.