
Figure 6.
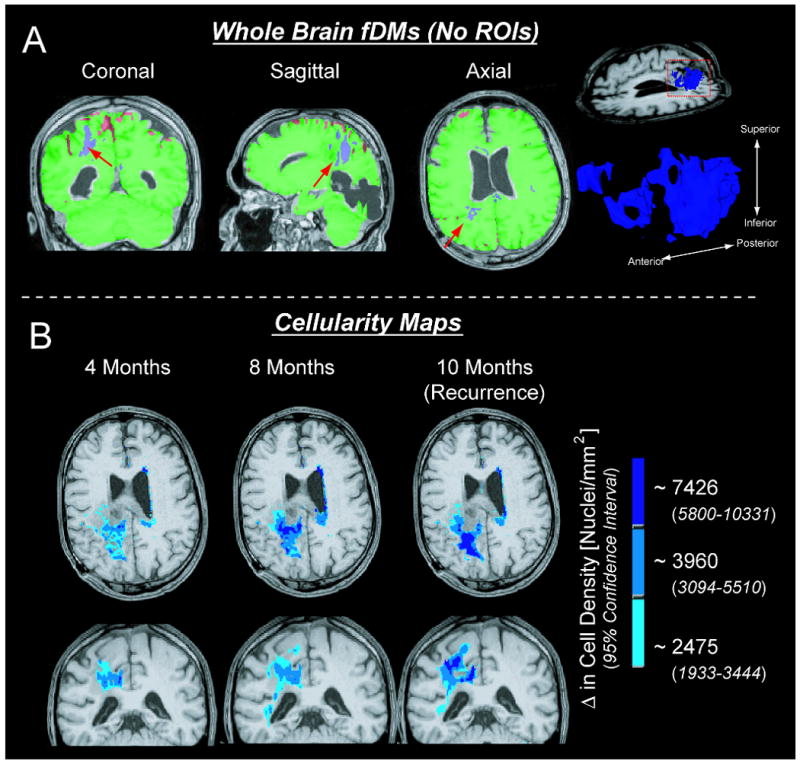
Novel applications of the fDM technique using ΔADC thresholds and cell density estimates found in the current study. A) By using the 95% confidence interval for a mixture of normal-appearing white matter, gray matter, and cerebrospinal fluid as the ΔADC threshold, no regions of interest need to be defined (whole brain fDMs). Arrows show regions of suspected tumor. B) Using the cell density estimates for ΔADC thresholds allows for “cellularity maps” to be generated, showing both the relative degree of cellularity and volume of suspected tumor.