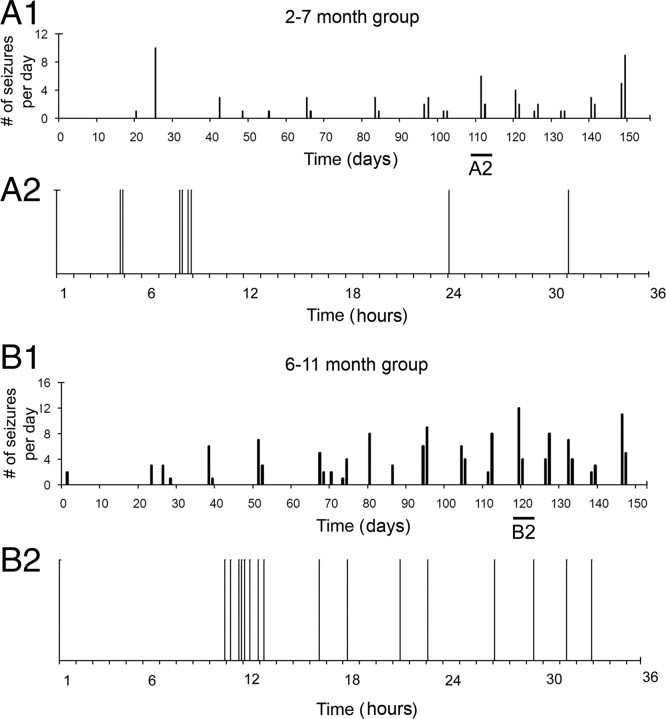
Figure 8.
Plots of the seizure frequency over time showing seizure clusters. Continuous EEG monitoring recorded virtually every seizure, which revealed clusters of seizures within periods of 24–48 h, followed by seizure-free periods of several days to a few weeks. A1, Seizure clusters seen in a rat implanted at 2 months of age with an expansion of seizure distribution within one of these clusters spread over 36 h (A2). Of note in the raster plot is the clustering of seizures occurring within a 42 min period in the eighth hour of the plot with interseizure intervals of 5, 28, and 9 min. B1, Temporal distribution of seizures within a cluster seen in a rat implanted at 6 months of age (B2). Note the overall increased number of seizures within clusters in B1 compared with A1. Also of note in B2 is the occurrence of eight seizures within a period of 140 min occurring ∼12 h into the plot with interseizure intervals of 25, 26, 19, 4, 19, 29, and 18 min consecutively.

