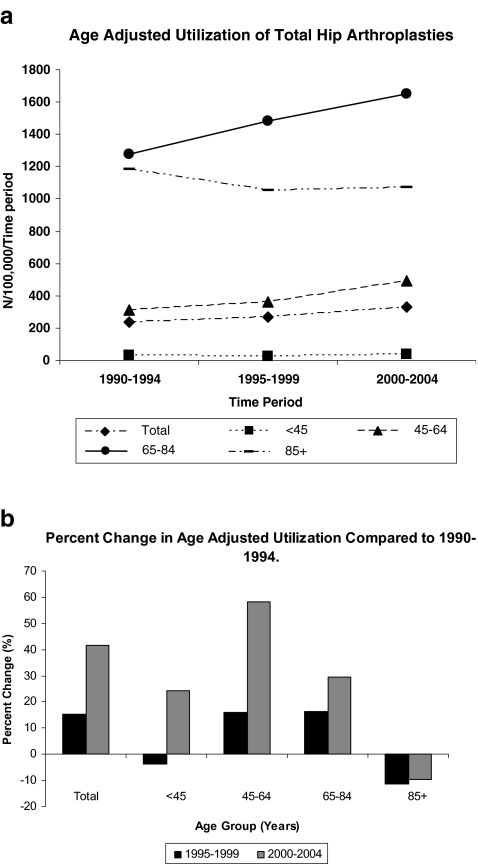
Fig. 1.
a Use of primary total hip arthroplasty in the three study periods expressed as number of total hip arthroplasties performed per 100,000 civilians. The figures show total implantation and age-group adjusted implantation per each 5-year study period. Age adjusted implantations are restricted to the stated age group. Significant differences (P < 0.001) between all time periods for age groups 46–65 and 65–84. Significant differences (P <0.001) for total implantation for 1990–1994 and 2000–2004 only. b Age group adjusted percent change of implantation of primary total hip arthroplasties over time for each 5-year study period. Age adjusted implantations are restricted to the stated age group

