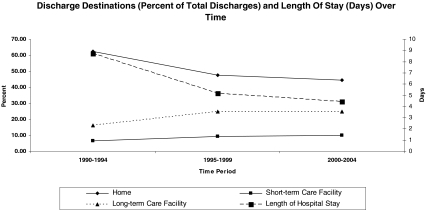
Fig. 2.
Discharge disposition as percent of all discharges (%) (left y-axis) and average hospital stay (days) (right y-axis) over time. Note that total percent of discharge dispositions may not add up to 100% as only selected disposition options are shown. Significant differences (P < 0.001) for all discharge destinations between all time periods, except for “long-term care facility” between 1995–1999 and 2000–2004. Significant differences (P < 0.001) for average hospital stay between all time periods

