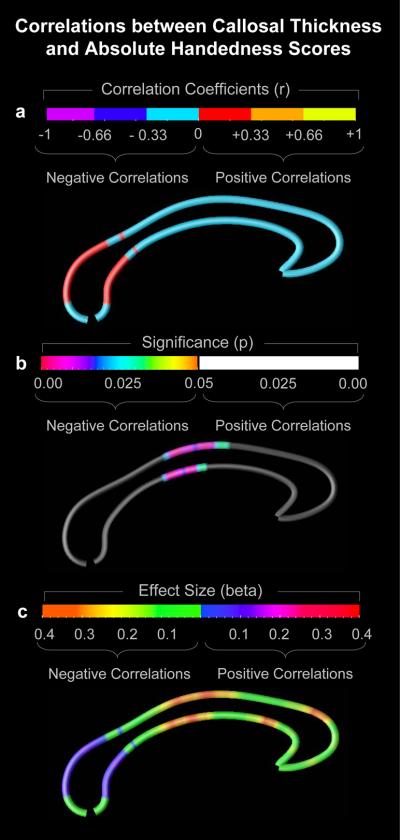
Figure 1.
Correlations between callosal thickness and handedness lateralization within the overall sample. (a) The callosal map and color bar encode the r-values that depict the magnitude and direction of correlations between absolute handedness scores and callosal thickness. (b) The callosal map and color bar encode the p-values that depict significant negative correlations at p≤0.05. (c) The callosal map and color bar encode the beta effect sizes that depict the magnitude and direction of the correlation. The posterior region of the corpus callosum is located on the left; the anterior region points to the right.

