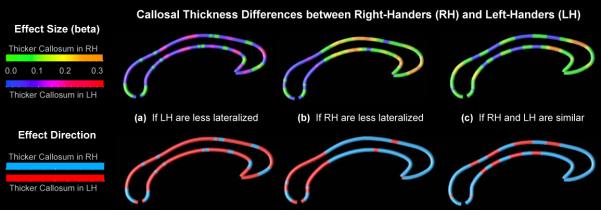
Figure 2.
Callosal thickness differences between right- and left-handers within the three specific samples. (a) More lateralized right-handers versus less lateralized left-handers (strong RH versus moderate LH). (b) More lateralized left-handers versus less lateralized right-handers (moderate LH versus weak RH). (c) Similarly lateralized right- and left-handers (moderate RH versus moderate LH). Top: The callosal maps and color bar encode the beta effect sizes that depict the magnitude and direction of the group differences. Bottom: The callosal maps and color bar encode the direction of the group differences, regardless of its magnitude.

