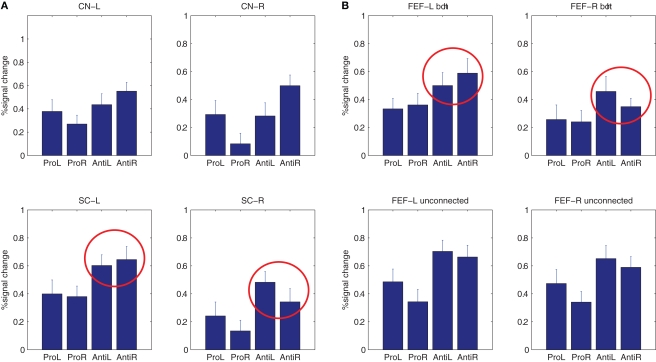
Figure 6.
(A) Average hemodynamic response amplitudes of the hemodynamic responses for each condition and FEF zone uniquely connected to the CN or SC. The lateralization observed for anti-saccades of the response amplitudes with respect to saccade direction is highlighted with red circles. Error bars denote standard error. (B) Same response amplitudes for FEF zones connected to both the CN and SC and for FEF zones connected to neither SC nor CN.

