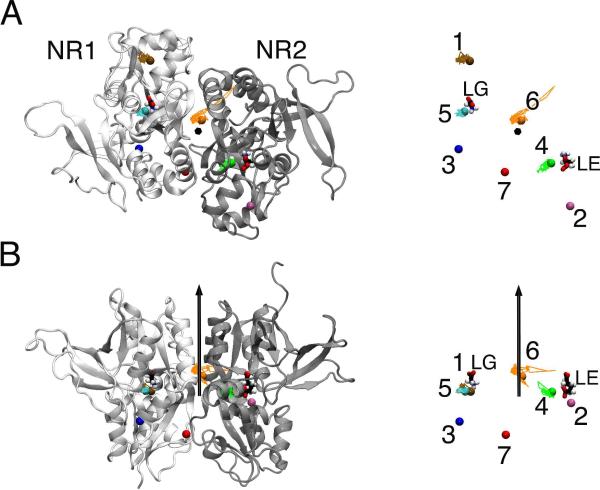
Figure 1.
Top (A) and side (B) views of xenon trajectories in the closed-cleft ligand-binding domain of the NMDA receptor (PDB code: 2A5T) over a 20-ns simulation. The black vector represents a pseudo two fold symmetric axis between the two subunits, NR1 (white) and NR2 (gray). The agonist glycine (LG) and glutamate (LE) are represented in stick. Initial xenon locations in the simulation are marked with spheres. Seven xenon atoms: Xe-1 in brown, flanked by helix-F and helix-G of NR1; Xe-2 in pink, flanked by helix-F and helix-G of NR2; Xe-3 in blue, flanked by helix-I and helix-K of NR1. Xe-4 (green) and Xe-5 (cyan) are next to the glutamate and glycine agonists, respectively. Xe-6 (orange) and Xe-7 (red) are located at the interface of NR1 and NR2. The xenon trajectories are shown in solid lines with the time step of 10 ps. For clarity, on the right, the xenon atoms and two agonists are labeled. The trajectories for Xe-2, Xe-3, and Xe-7 are not shown because they moved out of the protein during the simulation.

