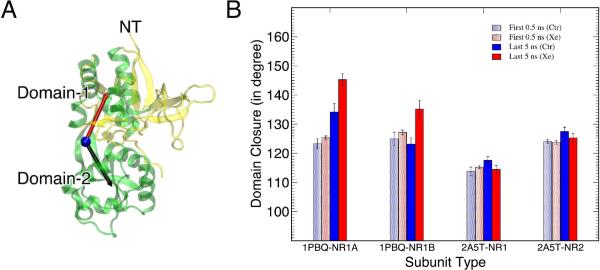
Figure 4.
(A) The structure of a ligand-binding domain (green) showing the definition of the domain closure. The blue sphere represents the hinge, the red and black vectors point to the center of mass of Domain 1 and Domain 2, respectively. The angle between the two vectors defines the domain closure. To prevent the bias from flexible loops, only the α helices of Domain 1 were included in the calculation of the center of mass. (B) Comparison of the domain closure in the open-cleft (1PBQ-NR1A & 1PBQ-NR1B) and closed-cleft (2A5T-NR1 & 2A5T-NR2) conformations in the absence (blue) or presence (red) of xenon at the first 0.5-ns (light color) and last 5-ns (dark color) MD simulations. Mean standard deviations were calculated using 50 or 500 frames from the first 0.5-ns or last 5-ns simulation, respectively.

