
Figure 5.
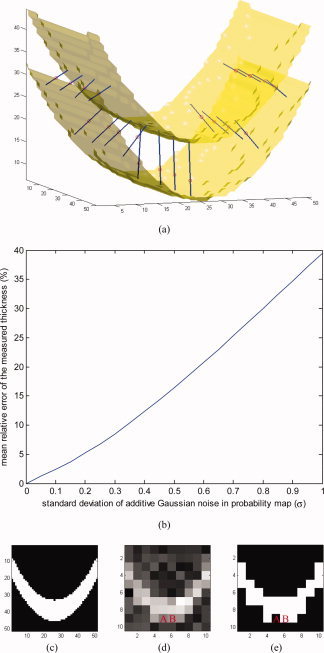
Results on an artificial probability map. (a) Inner and outer surfaces of a parabolic‐shaped layer of “GM” are depicted. Line segments are chosen by the algorithm such that they give the smallest integrals (of the probability map) among all line segments passing through every selected test point, here shown as small circles. (b) Relative error in measured thickness, introduced by additive Gaussian noise. (c) A 2D slice of the volume. (d) The same slice in a five‐times‐lower‐resolution volume with additive Gaussian noise. (e) Binary classification of the low‐resolution volume. [Color figure can be viewed in the online issue, which is available at www.interscience.wiley.com.]