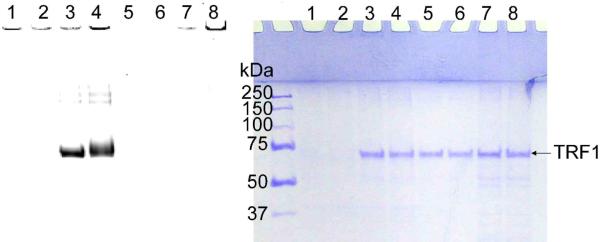
Figure 5.
Labeling of TRF1 by tankyrase-1 using 6-alkyne-NAD. The panel on the left shows the image of Rhodamine fluorescence, and the panel on the right is the same gels stained with Coomassie blue. Lanes 1 and 2: tankyrase-1 suspension (0.09 μg/μL) with 6-alkyne-NAD (100 μM); 3 and 4: tankyrase-1 suspension (0.09 μg/μL) and TRF1 (1.1 μM) with 6-alkyne-NAD (100 μM); 5 and 6: TRF1 (1.1 μM) with 6-alkyne-NAD (100 μM); 7 and 8: suspension of the insoluble fraction of non-infected SF9 cell lysate (0.15 μg/μL, negative control) and TRF1 (1.1 μM) with 6-alkyne-NAD (100 μM). Lanes 2, 4, 6, and 8 contained normal NAD (100 μM).

