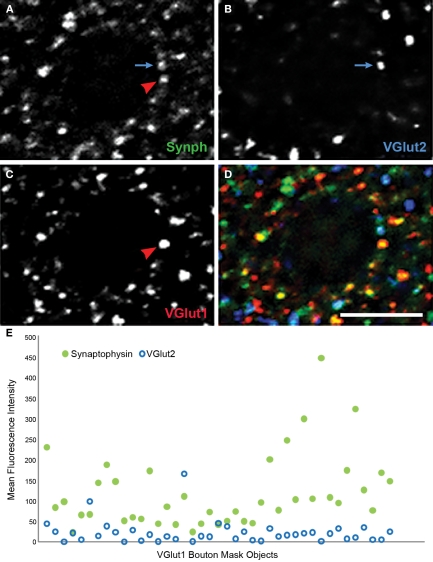
Figure 8.
Human primary auditory cortex tissue labeled for synaptophysin (Synph, green), VGlut2 (blue), and VGlut1 (red). (A–D) Arrows demonstrate colocalization between synaptophysin and either VGlut1 or VGlut2. (E) VGlut2, and synaptophysin fluorescence intensities extracted from mask objects of the VGlut1-immunoreactive boutons in the micrograph shown in (A)–(D). It can be seen that quantitative data reflecting the degree of colocalization are readily extracted. Bar = 5 μm.

