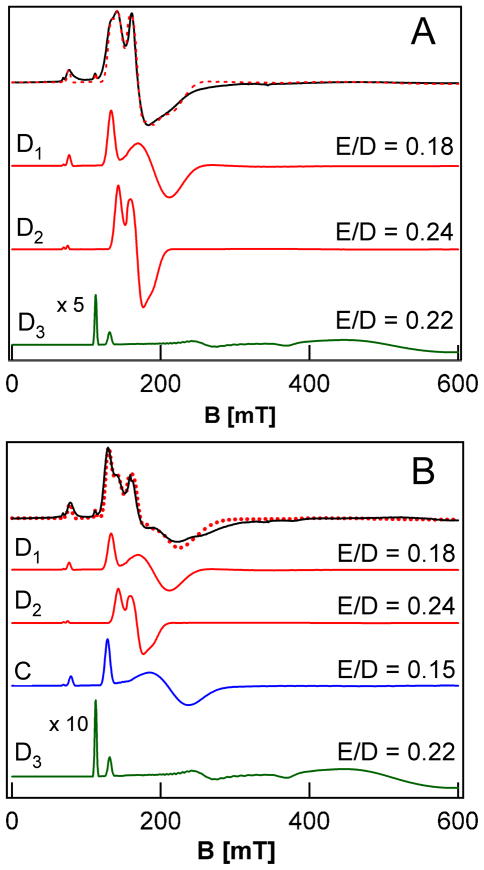
Figure 2.
Perpendicular-mode X-band EPR spectra of the ferric reaction products of 1 with 1,4-CHD (A) and the products from self-decay of 1 (B). A: 8 K spectrum of the reaction products of 1 with 1,4-CHD (black solid line) together with a simulation (red dashed line) composed of the individual spectra of D1, D2, and D3 shown below the data. B: 8 K spectrum of the products from self-decay of 1 (black solid line). The simulation (red dashed line) contains the contributions (shown separately below) from D1, D2, D3, and C. For visual clarity, the signal intensity of D3 has been increased 5-fold and 10-fold, respectively, in panels A and B. Conditions: microwave frequency, 9.62 GHz, microwave power, 2 mW, modulation amplitude, 1 mT.

