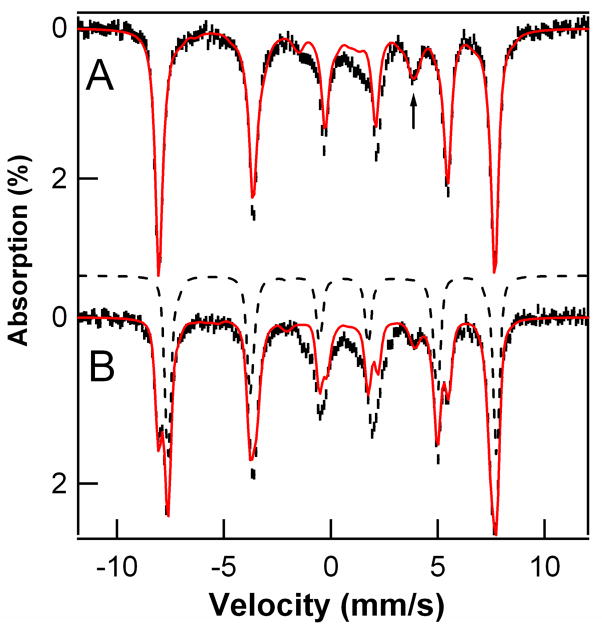
Figure 3.
Mössbauer spectra of the products from the reaction of 1 with 1,4-CHD (A) and that from self-decay of 1 (B). Spectra were recorded at 4.2 K in a 45 mT parallel applied magnetic field. Red solid lines are spectral simulations based on eqs 1, using the parameters listed in Table 2. The arrow in (A) highlights the high-energy line of the spectral feature associated with the middle Kramers doublet of the S = 5/2 spin manifold. Black dashed line in B is the simulation of the S = 5/2 species C.

