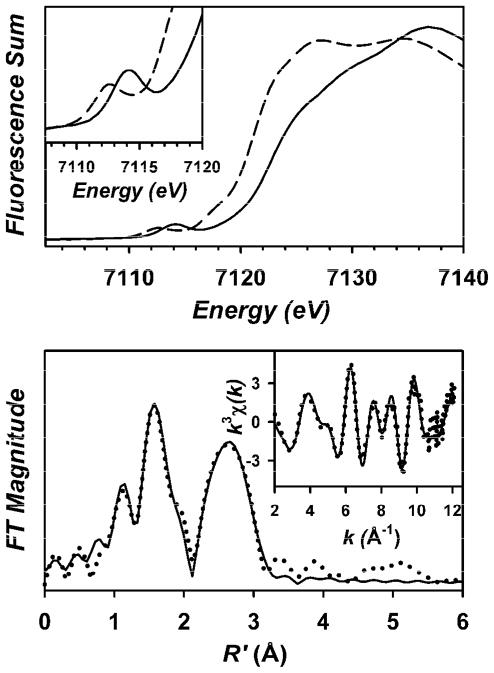
Figure 4.
Top: X-ray absorption edge spectra of 2 (– – –) and D (–––). The inset shows an expansion of the pre-edge region. Bottom: Fe K-edge unfiltered EXAFS data (k3χ(k), inset) and the corresponding Fourier transform of D. Experimental data are shown with dotted (•••) lines and fits with solid (–––) lines. Please see Supporting Information for further details of the EXAFS analysis.

