Figure 6.

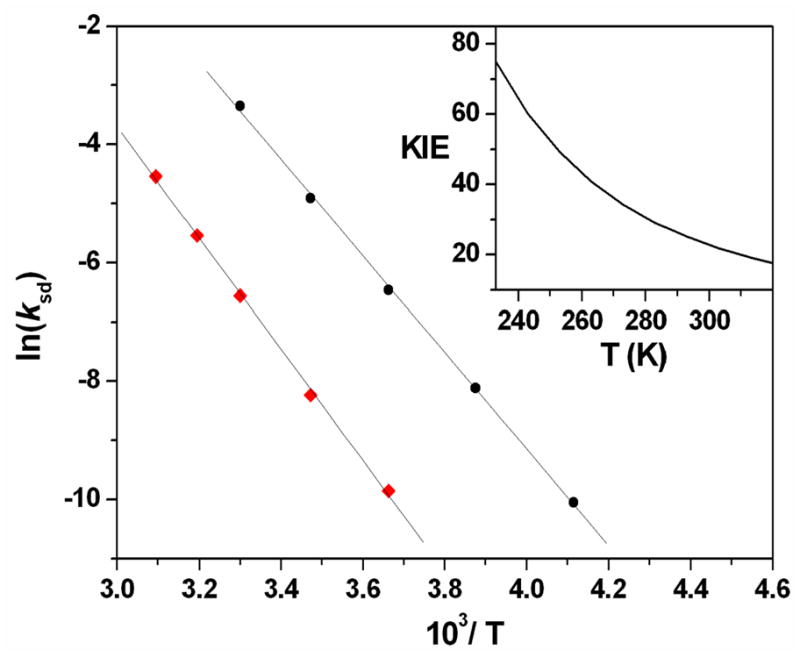
Main: Arrhenius plot of ln ksd vs. 1/T for 1 (●) and d36-1 ( ). Inset: Variation in the KIE upon self-decay of 1 as a function of temperature, derived from fitting to the Arrhenius plot.

Main: Arrhenius plot of ln ksd vs. 1/T for 1 (●) and d36-1 ( ). Inset: Variation in the KIE upon self-decay of 1 as a function of temperature, derived from fitting to the Arrhenius plot.