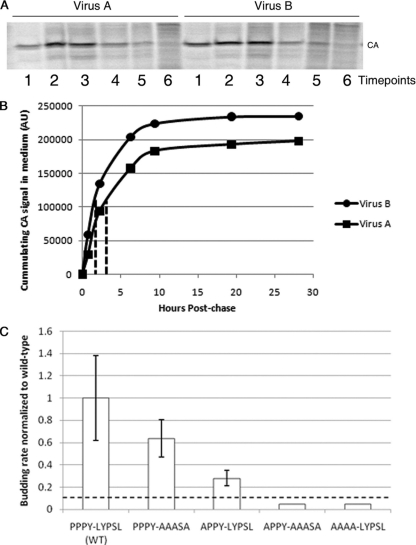
FIG. 2.
Effects of mutation of the LYPSL motif on the budding rate. (A and B) Overview of the method used to measure budding rates of late domain mutants. (A) Example of SDS-PAGE PhosphorImager scans of the CA bands representing different time points for one of the mutants (virus A) (left) and for the wild type (virus B) (right). Each lane represents the virus collected from the medium at one time point, starting with the first collection after the pulse (lanes 1). (B) Example plots of cumulative virus release. The CA bands from the experiment shown in A were quantified, and the cumulative intensity was plotted as a function of the chase time. The half-time of virus release for these two curves is shown by the dotted lines. AU, arbitrary units. (C) Budding rates of late domain mutants. Budding half-times, or the time at which half of the final amount of labeled virus was released into the medium, were calculated based on curves like those in B and then normalized to the budding half-time of the wild type in the same experiment. The normalized budding rate on the y axis is the reciprocal of the budding half-time. The budding rates of the APPY-AAASA and AAAA-LYPSL mutants were lower than the detection level of this assay, represented by the dashed line, and thus remain undetermined. Error bars represent standard deviations from the means. The P values obtained from a Student's t test for the budding rates for the wild type and the PPPY-AAASA mutant and for the wild type and the APPY-LYPSL mutant were both significant (P < 0.05).

