FIG. 2.
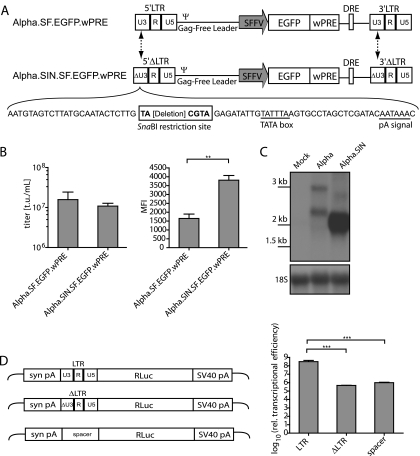
Self-inactivating deletion of Alpha.SF.EGFP.wPRE. (A) Schematic depiction of the Alpha.SF.EGFP.wPRE vector (proviral DNA) and its self-inactivating derivative Alpha.SIN.SF.EGFP.wPRE (proviral DNA). The sites of sequence deletions are indicated by dashed arrows. The nucleotide sequences of the self-inactivating U3 region (ΔU3) and the introduced SnaBI restriction site, as well as those of the TATA box and the polyadenylation signal (pA signal), are shown. (B) Comparative titer and mean fluorescence intensity (MFI) analyses as determined on transduced HT1080 cells. Viral particles were generated by cotransfection of pcDNA3.alpha.gag/pol.CO, the VSVg envelope expression plasmid, and either pAlpha.SF.EGFP.wPRE or pAlpha.SIN.SF.EGFP.wPRE. Six days posttransduction, cells were harvested and subjected to flow cytometric analysis. t.u., transducing units. (C) Northern blot analysis of transduced HT1080 cells. A radiolabeled EGFP-specific probe was used to detect all RNA species resulting from EGFP transcription. The expected mRNA sizes for the Alpha.SF.EGFP.wPRE vector are 2,610 bp (LTR transcript) and 1,847 bp (internal transcript). For the Alpha.SIN.SF.EGFP.wPRE vector, the corresponding transcripts are 2,451 bp and 1,688 bp, respectively [sizes without the poly(A) tail are given]. The blot was reprobed with an 18S rRNA-specific probe as a loading control. Molecular size standards are given on the left. (D) Luciferase assay to assess transcriptional activities of the LTRs. 293T cells were transfected, and total protein was lysed as described in Materials and Methods. Relative transcriptional activity was determined as relative light units normalized to the amount of protein and the transfection efficiency. Values were log-transformed, and a Student two-tailed t test was performed for comparison of differences between the indicated groups. A P value of <0.05 (*) was considered significant; a P value of <0.01 (**), very significant; a P value of <0.001 (***), extremely significant.

