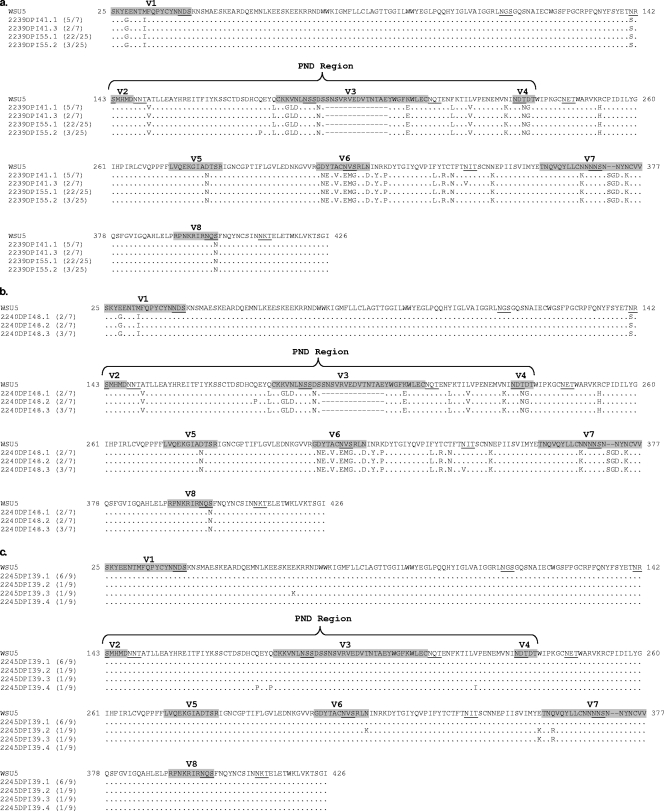
FIG. 5.
Deduced amino acid sequences of single plasma viral RNA RT-PCR amplicons from A2239 at 41 and 55 dpi (a), A2240 at 48 dpi (b), and control SCID foal A2245 at 39 dpi (c). The EIAVWSU5 inoculum consensus sequence for comparison is shown at the top. For each unique sequence, the ratio of the number of amplicons with that sequence to the total number of amplicons sequenced is indicated in parentheses. Hypervariable regions V1 to V8 are labeled and shaded, and the PND region is indicated. PNLGS are underlined.

