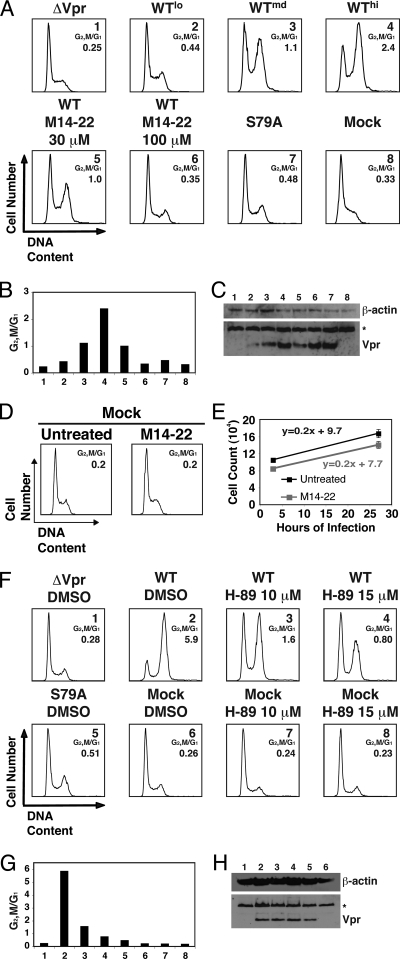
FIG. 5.
Inhibition of PKA kinase activity abrogates virion-delivered Vpr cell cycle arrest. (A) Vpr was delivered by nonreplicative virions (Vprv) into Jurkat cells and the samples were treated with M14-22 (30 or 100 μM) at the time of infection. Untreated WT Vprv was titrated (lo, low; md, medium; hi, high) to provide a matched Vpr protein control for the M14-22-treated samples. Cells were also infected with virions containing no Vpr (ΔVpr), virions containing mutant Vpr (S79A), or uninfected (Mock). Histograms of cell cycle analysis at 24 h postinfection show DNA content of propidium iodide-stained cells by flow cytometry. (B) G2/M and G1 populations were modeled by using the Dean-Jett-Fox cell cycle model, and the ratio was plotted for the cells corresponding to the numbered samples in panel A. (C) Western blot of the correspondingly numbered samples in panel A displays Vpr (bottom) or β-actin (top). The asterisk denotes a cellular protein cross-reactive with the Vpr antibody that serves as a secondary loading control. (D) Jurkat cells were mock infected and either left untreated or treated with M14-22 (100 μM). Histograms of cell cycle analysis at 26 h postinfection show DNA content of DRAQ5-stained cells by flow cytometry. G1 and G2/M populations were modeled by using the Watson Pragmatic cell cycle model, and the ratio was determined. (E) Total viable cell counts at 2 and 26 h postinfection for the mock-infected samples in panel C measured by constant time flow cytometry (data are represented as mean ± the standard deviation [SD] of duplicates and are representative of more than five experiments). Linear regression analysis of the data was performed and plotted as a line with the equation. (F) WT Vpr was delivered (Vprv) into Jurkat cells and treated with either the DMSO vehicle or H-89 (10 or 15 μM) at the time of infection. Virions devoid of Vpr (ΔVpr), mutant Vprv (S79A) delivery, and mock infection were included as controls. Histograms of cell cycle analysis at 22 h postinfection show DNA content of propidium iodide-stained cells by flow cytometry. (G) G2/M and G1 populations were modeled by using the Watson Pragmatic cell cycle model, and the ratio was plotted for the cells corresponding to the numbered samples in panel F. (H) Western blot indicates Vpr protein delivery for DMSO- or H-89-treated Jurkat cells in panel F (bottom). β-Actin is shown as a protein loading control (top). The asterisk in the bottom blot denotes a cross-reactive cellular protein that is used as a secondary loading control.

