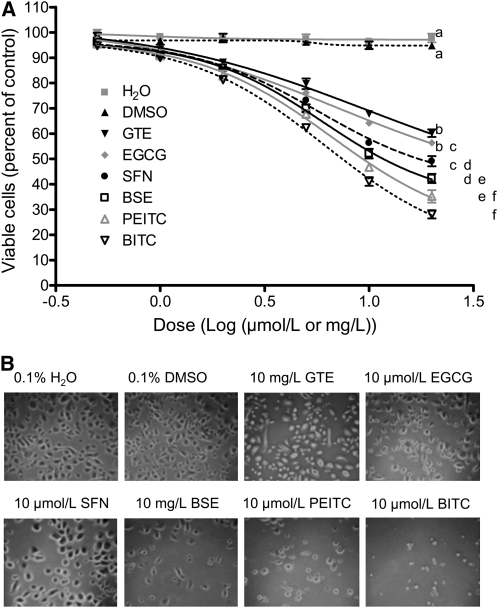
FIGURE 1 .
Cytotoxicity of GTE, BSE, EGCG, SFN, PEITC, and BITC in NHBE cells. (A) Cells were treated with each of the agents for 48 h. Data are means ± SEM, n = 2 means of triplicate measures. For each agent, the effect of the dose was significant. Agents differed significantly from one another at 2 units/L with differences shown at 20 units/L where means without a common letter differ, P < 0.05. (B) Phase contrast images of NHBE cells after 48 h treatments.

