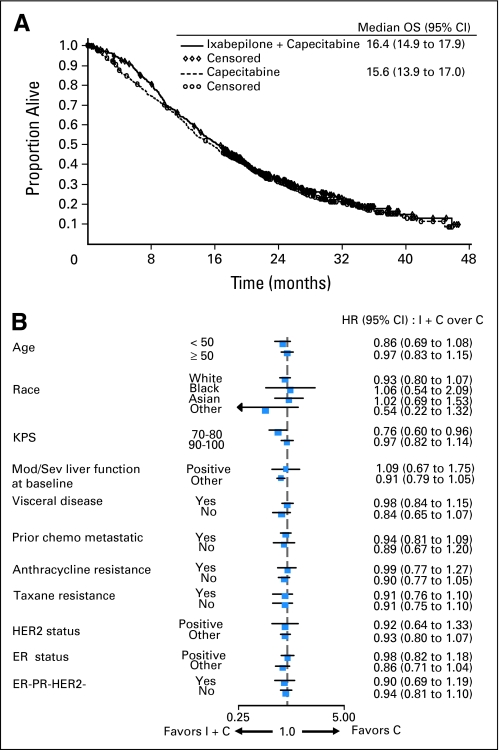
Fig 2.
(A) Overall survival (OS) Kaplan-Meier curves. OS distribution for the treatment arms receiving ixabepilone combination (I + C) versus capecitabine alone (C) are shown. (B) OS hazard ratio (HR) and 95% CI for subset analyses. HRs less than 1 favor combination therapy. KPS, Karnofsky performance status; Mod, moderate; Sev, severe; chemo, chemotherapy; HER2, human epidermal growth factor receptor 2; ER, estrogen receptor; PR, progesterone receptor.

