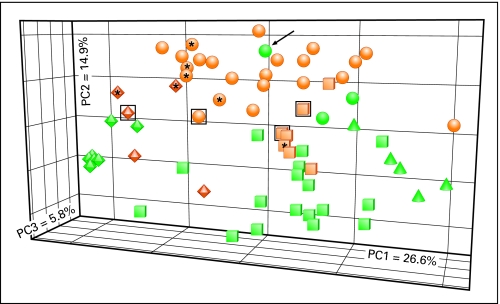
Fig 4.
Principal component analysis (PCA) shows differences and similarities between pediatric and adult glioblastoma. PCA was generated using the 1,000 most variable probes and glioblastomas from our pediatric cohort and from published data from adult glioblastoma.22,31 Pediatric and adult tumors are shown in orange and green, respectively. Tumor subgroups are indicated by shape as follows: proneural (diamonds), proliferative (Prolif; spheres), mesenchymal (Mes; cubes), and Prolif/Mes (cones). Adult tumor subgroups are based on Lee et al.31 Asterisks indicate irradiation-induced tumors. Arrow indicates tumor from 53-year-old patient. Black boxes indicate tumors from infants.

