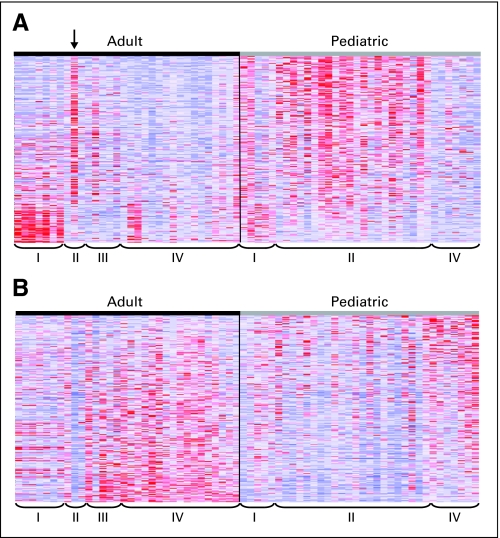
Fig 5.
Differential expression of PDGFRA and EGFR gene signatures in pediatric versus adult glioblastoma. Gene sets that are either upregulated in PDGFRA-amplified tumors (The Cancer Genome Atlas [TCGA] PDGFRA set) or upregulated in EGFR-amplified tumors (TCGA EGFR set) were identified using TCGA data from adult glioblastomas and used for gene set enrichment analysis (GSEA) to compare our pediatric glioblastoma data to published adult glioblastoma data.22,31 Expression heat maps of (A) the TCGA PDGFRA set genes and (B) the TCGA EGFR set genes in adult and pediatric glioblastomas are shown. Tumor subgroups are indicated by proneural (PN; I), proliferative (Prolif; II), Prolif/mesenchymal (Prolif/Mes; III), and Mes (IV). Adult tumor subgroups are based on Lee et al,31 and pediatric tumor subgroups are based on unsupervised hierarchical clustering. Arrow indicates tumor from a 53-year-old patient. GSEA showed significantly increased expression of the TCGA PDGFRA set (nominal P = .116, false discovery rate [FDR] = 0.121), whereas the TCGA EGFR set is downregulated in pediatric high-grade gliomas (nominal P = .229, FDR = 0.238) as well as the adult PN subclass. Overexpression of the TCGA PDGFRA set and underexpression of the TCGA EGFR set shows even greater enrichment in pediatric glioblastoma if pediatric tumors in the Mes subgroup are removed from the analysis (upregulation of PDGFRA gene set; nominal P = .048, FDR = 0.108 and downregulation of EGFR gene set, nominal P = .108, FDR = 0.108).

