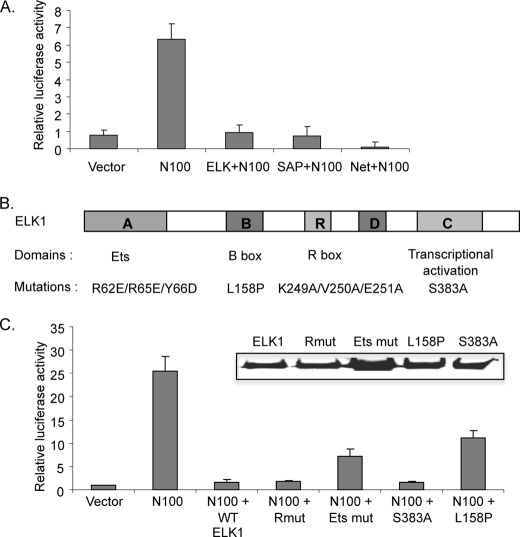
FIGURE 3.
Repression of MKL1 activation by ELK1. A, TRE cells were transfected with pFosWTGL3 reporter containing the SRE region of the mouse c-fos promoter (79), pRevN100 expressing the MKL1 N100 deletion mutant, and each TCF family expression plasmid. As an internal control pRLSV40P, with the SV40 promoter driving Renilla luciferase gene, was also transfected. Cells were harvested 48 h after transfection, and Firefly and Renilla luciferase activities were measured. Firefly luciferase levels were normalized to Renilla levels to control for transfection efficiencies. Results were then normalized as fold activation relative to the level measured in TRE cells transfected with empty vectors. Data are the mean value from three experiments with error bars showing the standard deviations. B, schematic diagram of the ELK1 protein domains and mutations. The mutations in ELK1 are indicated below each domain. C, cells were transfected as in A with the indicated ELK1 mutants. Inset, the expression of wild type and each ELK1 mutant was detected by immunoblotting with anti-hemagglutinin antibodies.

