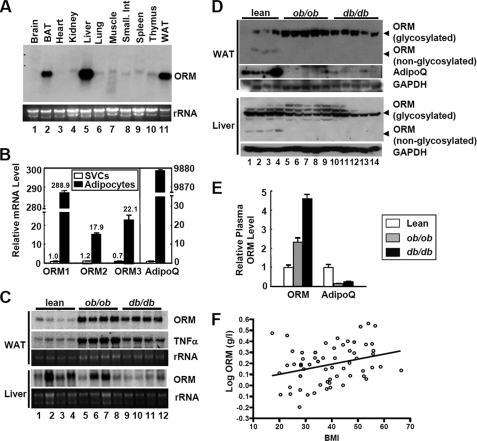
FIGURE 1.
Orm is induced in the plasma and adipose tissues of obese subjects. A, Northern blot analysis of Orm expression in various mouse tissues. BAT, brown adipose tissue; WAT, white adipose tissue. B, mRNA levels of each Orm isoform in adipocytes and SVCs from epididymal adipose tissues of lean C57BL6 mice. Adiponectin (AdipoQ) was used as an adipocyte-specific marker gene. n = 4. C, Northern blot analysis of Orm expression in the liver and adipose tissue of obese ob/ob and db/db mice. D, Western blot analysis of ORM protein expression in the liver and adipose tissue. As ORMs are heavily glycosylated proteins (about 45% of their total mass is composed of carbohydrates), Western blot analysis of ORM with tissue samples accompanies both its glycosylated as well unglycosylated forms, as illustrated. GAPDH, glyceraldehyde-3-phosphate dehydrogenase. E, ORM protein level in the plasma of lean and obese mice. n = 4 or 5. F, correlation of plasma ORM level with body mass index (BMI). Serum ORM level was measured by enzyme-linked immunosorbent assay and plotted in accordance with body mass index. R = 0.3, p = 0.021.

