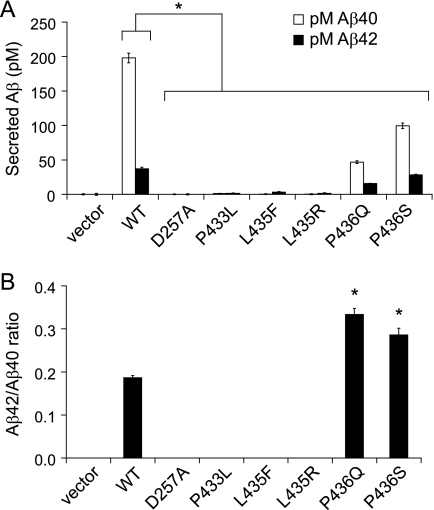
FIGURE 5.
PS1 L435F and neighboring mutations cause marked reductions in the generation of both Aβ40 and Aβ42. WT and mutant PS1 were co-expressed with APP C99-myc by transient transfection in PS-null MEFs, and the levels of secreted Aβ40 and Aβ42 were quantified by ELISA. Vector indicates transfection with empty rather than PS1-expressing vector. Representative expression of PS1 and APP C99 for the same series of experiments is shown in Figs. 2A and 3A. A, Aβ levels (pm) in conditioned medium were measured by sandwich ELISA with antibodies specific for Aβ40 and Aβ42. The levels of Aβ40 and Aβ42 were at or below the threshold of detection for D257A, P433L, L435F, and L435R mutations. B, the concentration ratio of Aβ42/Aβ40 was calculated for mutations producing detectable levels of both cleavage products. Although total amounts of Aβ were significantly reduced for all mutations, the P436Q and P436S mutations resulted in an elevated Aβ42/Aβ40 ratio because of a greater reduction in Aβ40 than in Aβ42. Data shown are means of three separately transfected replicates and are a representative example from three independent experiments (A, *, p < 0.05 versus Aβ40 or Aβ42 levels, respectively, in cells transfected with WT PS1; B, *, p < 0.05 versus Aβ42/40 ratio for WT PS1; n = 3).

