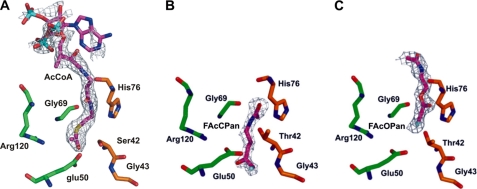
FIGURE 3.
Active sites of ligand-bound FlK with 2Fo − 2Fc electron density map for T42SFlK·AcCoA (A), WtFlK·FAcCPan (B), and WtFlK·FAcOPan (C). The molecules of AcCoA, FAcCPan, and FAcOPan are all shown in a deep purple color. Green and orange colors indicate residues from the two protomers of the dimer.

