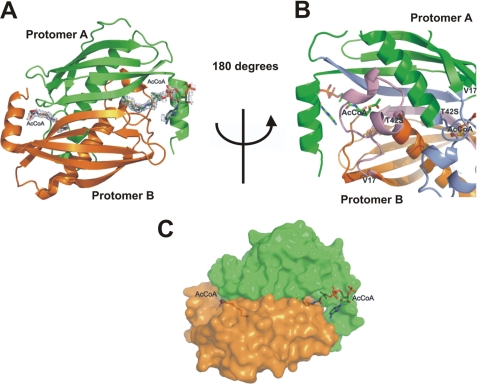
FIGURE 4.
Overall structure of T42SFlK in complex with AcCoA. The two protomers of the T42SFlK dimer are represented in green and orange colors, respectively. A, 2Fo − 2Fc electron density map shows that AcCoA is bound between two protomers of the active FlK dimer. B, AcCoA is sandwiched between the long β-sheet and two small α-helices formed by residues 17–42. The long β-sheet and two small α-helices of protomer A and B are shown in light blue and light purple, respectively. C, representation of the molecular surface shows that only the acetyl and β-mercaptoethylamine moieties from AcCoA are buried in the active site of the protein.

